
I know, I know ... Probably the last thing in the world you want to do is review Census data.
But the fact is, numbers matter. It matters that a resident in western Shaker Heights is 24 times more likely to have at least a bachelor's degree as is a resident in northern Woodland Hills ... that a wealthy household is three times more likely to live in Shaker Square than they are to live in western Buckeye ... That the unemployment rate in southern Woodland Hills is more than twice as high as in western Larchmere.
The numbers matter if we are to understand the very real challenges that community heroes in Buckeye face ... And why connectivity to other parts of the Buckeye-Shaker neighborhood is so critical. They matter if we are to address the fact that economic and racial inequality happens not just at the city level but also block by block. They matter in appreciating the immense work and energy that community organizations like Buckeye Shaker invest in bringing back healthy, diverse communities.
And so yes, here is the obligatory data post.
Below, we take a brief look at the seven census tracts that make up and surround the Buckeye-Shaker neighborhood - both through a 6-mile walk through the neighborhood and a look at what the 2009-2013 American Community Survey reveals about each.
At this geographic level, we have an opportunity to see life in the community at a really fine-grained level - to see how circumstances in each part of the neighborhood match up.
But enough with the explaining ... Let's get started on our walk!
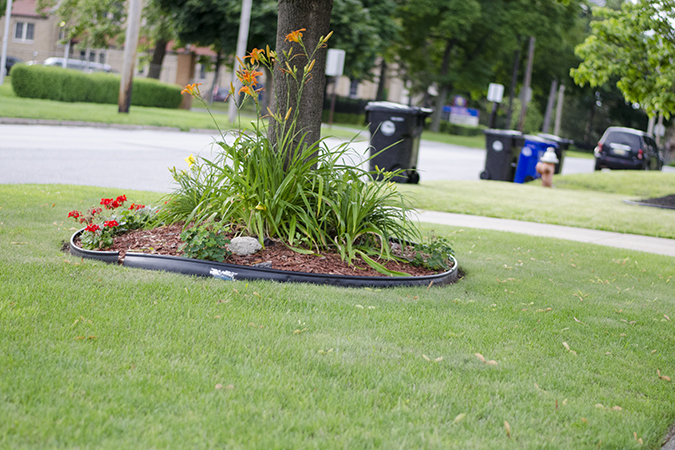
I take off from our house on E. 117th in Buckeye and head west into the bordering Woodland Hills area. To our south, this census tract is home to one of Cleveland's most popular recreation areas, the 116-acre Luke Easter Park. Along Forest Avenue, carefully maintained houses sit next to vacant properties in various stages of neglect.
Turning the corner onto Martin Luther King Jr. Drive, the houses get more stately and the landscaping more manicured, with historic churches and schools dotting the other side of the street.
There are challenges here. More than half of children in this census tract live in poverty. Two of every five residents has relied on food stamps in the past year. Nearly a quarter of residents lack healthcare coverage. Still, along this walk, schools, church congregations and well-maintained houses and yards are clear signs that there are big community assets here.


Total Population: 2,344
Residents of Color: 96.9%
Percentage Children: 18.4%
Median Age: 42.5
Median Household Income: $21,190
Below Poverty Line: 32.8%
Household Income $75,000 or More: 7.2%
Food Stamp Benefits in Past Year: 40.7%
Lack Health Insurance: 23.6%
Unemployment Rate: 34.9%
25 and Older with Less than High School Diploma: 20.2%
25 and Older with at Least Bachelor's Degree: 6.1%
Heading north on Martin Luther King Junior, I walk over a bridge to the clattering of the Rapid tracks, as a train heads from downtown toward the eastern suburbs. The northern stretch of Woodland Hills is a far cry from the economic strength of either of those two areas.
In fact, among the seven census tracts on our walk, it faces some of the largest challenges. The average household income here is less than $14,000 per year, so it's no surprise that nearly two-thirds of residents live below the federal poverty line. Residents are 10 times more likely to lack a high school diploma than they are to have a bachelor's degree.
It's probably worth noting that this is also the Census Tract with the largest non-White population. Residents of color (all non-Caucasian residents, together with Caucasian residents of Latino origin) make up 99.2% of the population. Across all of these Census Tracts, areas with the largest minority populations appear to face the largest economic and social challenges.
While those statistics are sobering, this is also an area with some enormous assets. It's home to a large-scale shopping plaza and the Cleveland Clinic's Children's Hospital for Rehabilitation. The Cleveland Botanical Garden's massive Buckeye Learning Farm has exploded community gardening and youth employment opportunities. And $100 million has been invested in the St. Luke's campus, bringing a shuttered hospital back to life as new housing, new schools and a new library.
The potential for improving the lives of residents here is clearly huge.


Food Stamp Benefits in Past Year: 61.5%
Lack Health Insurance: 9.8%
Unemployment Rate: 41.4%
25 and Older with Less than High School Diploma: 33.8%
25 and Older with at Least Bachelor's Degree: 3.3%
Total Population: 4,009
Residents of Color: 99.2%
Percentage Children: 40.9%
Median Age: 25.7
Median Household Income: $13,867
Below Poverty Line: 64.4%
Household Income $75,000 or More: 3.4%
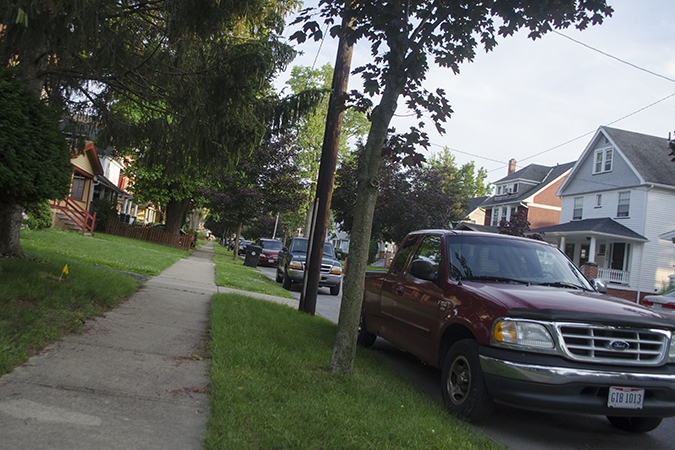
Winding up Martin Luther King Junior brings us to Larchmere, an area of the neighborhood whose signage boasts of "upbeat vitality" and "offbeat charm". The visual change entering the district is evident; while there are still some lots and homes in disrepair, their numbers are fewer. There's an eclectic mix of shops and in-fill houses, tied together by a recent $2.8 million streetscape improvement.
The data are starkly different, too. There are still economic challenges, to be sure, but the unemployment rate is only a fifth of that in northern Woodland Hills, and residents are more than 10 times more likely to have a bachelor's degree than in that tract. It's also an area with a decidedly older population; the senior population is larger here than in any of our other census tracks, and the average resident age is over 45 - nearly 20 years older than the average resident in northern Woodland Hills.


Food Stamp Benefits in Past Year: 22.0%
Lack Health Insurance: 9.8%
Unemployment Rate: 8.0%
25 and Older with Less than High School Diploma: 16.1%
25 and Older with at Least Bachelor's Degree: 34.3%
Total Population: 1,940
Residents of Color: 85.9%
Percentage Children: 14.5%
Median Age: 45.4
Median Household Income: $31,596
Below Poverty Line: 23.2%
Household Income $75,000 or More: 6.7%
Heading eastward on Larchmere Boulevard, we reach the border of Cleveland and head into Shaker Heights. The 110-year-old "garden suburb" is renowned for its winding boulevards, stately homes, 600 acres of parkland and its considerable racial diversity.
It's a far cry from the ground conditions just a mile to the west. Here, household incomes and education levels are high and unemployment is low. While this census tract has the lowest minority population of our seven (at 40.1%), it's still well above the national average of 36.6%. On the economic front, though, it's far better-off than its neighbors, with more than a third of households making more than $75,000 annually.


Food Stamp Benefits in Past Year: 6.3%
Lack Health Insurance: 6.0%
Unemployment Rate: 5.5%
25 and Older with Less than High School Diploma: 3.5%
25 and Older with at Least Bachelor's Degree: 79.1%
Total Population: 1,831
Residents of Color: 40.1%
Percentage Children: 21.7%
Median Age: 35.6
Median Household Income: $62,174
Below Poverty Line: 11.0%
Household Income $75,000 or More: 38.9%
Coventry Road winds us back down to Shaker Boulevard and back into Cleveland. We've reached Shaker Square, a leafy square of businesses laid out in the 1920s as one of the nation's first planned shopping districts. Down its middle, the square is punctuated down the middle by the Rapid's train tracks, and around its edges, a variety of apartment complexes built from the 1920s to the 1960s make it one of the city's densest areas.
It's a diverse area on all levels. Residents of color make up nearly 70% of the population. More than a quarter of residents live below the poverty line, while nearly a quarter of households have annual income of greater than $75,000. Opposite this diversity, it's also a well-educated census tract - more than half of adults have at least a bachelor's degree, and only about 6% lack a high school diploma.


Food Stamp Benefits in Past Year: 17.5%
Lack Health Insurance: 8.4%
Unemployment Rate: 6.8%
25 and Older with Less than High School Diploma: 6.1%
25 and Older with at Least Bachelor's Degree: 51.8%
Total Population: 2,980
Residents of Color: 69.7%
Percentage Children: 25.9%
Median Age: 32.5
Median Household Income: $30,655
Below Poverty Line: 25.4%
Household Income $75,000 or More: 18.5%
We're not even halfway around the square, and suddenly, we've found ourselves in a new census tract ... And this is a tricky one. While all of the other tracts are pretty compact, this one stretches from the eastern part of Larchmere, down to part of Shaker Square and then into the eastern end of the Buckeye area.
Each of these areas - even so close together - have their own identities, histories and characteristics ... So it's little harder here to draw conclusions from the data. Still, some things stick out. Of our seven census tracts, this is the area with the smallest presence of children; those 17 and under make up only 11.5% of the population - less than a third of the proportion in northern Woodland Hills. It's also the area with the oldest average age, at 47.


Food Stamp Benefits in Past Year: 35.5%
Lack Health Insurance: 18.9%
Unemployment Rate: 9.3%
25 and Older with Less than High School Diploma: 12.1%
25 and Older with at Least Bachelor's Degree: 19.1%
Total Population: 1,872
Residents of Color: 74.7%
Percentage Children: 11.5%
Median Age: 47.1
Median Household Income: $20,417
Below Poverty Line: 25.4%
Household Income $75,000 or More: 10.4%
Heading down East 126th Street, I'm back on familiar ground. As the sun casts an orange hue around me, I turn down Buckeye Road, to its beautiful balconies, street art and yes, signs of neglect and disinvestment. Even though we've only been living in this census tract for a few weeks, it feel like home, and I realize I'm rooting for this area.
Despite its high poverty rate (41%), despite the fact that nearly one in five residents lacks health insurance, despite the fact that nearly half of residents relied on food stamps in the past year ... there's much promise here. So many passionate people working so hard not only for themselves but for the betterment of their community.
And that civic energy is something that ties all of these census tracts together. Despite their very different circumstances, what makes this neighborhood stand out in my head is the great amount of care that people take with one another. That's a kind of authentic community stewardship that doesn't start of stop at artificial geographic boundaries, and if we're to see this area move to its full potential, this citizen energy is going to be the fuel.


Food Stamp Benefits in Past Year: 45.3%
Lack Health Insurance: 18.0%
Unemployment Rate: 16.6%
25 and Older with Less than High School Diploma: 13.1%
25 and Older with at Least Bachelor's Degree: 11.0%
Total Population: 1,783
Residents of Color: 96.6%
Percentage Children: 24.9%
Median Age: 32.1
Median Household Income: $24,000
Below Poverty Line: 41.2%
Household Income $75,000 or More: 6.6%
Before we go, just a couple notes of caution about the data:
- Census tracts are big: The area we're talking about covers 18.5 square miles - and the photos you'll see are on just a handful of streets in that area. These aren't necessarily representative of the entirety of the neighborhood - just a flavor of what you might see here.
- The data is an estimate: The US Census gives us a really, really good idea of what's happening in places, but because it's only administered once a decade, its information from 2010 is already pretty dated. The American Community Survey, meanwhile, collects data monthly, and we're able to get census tract data from as recently as 2013. However, only about 1% of Americans are surveyed each year, so keep in mind, this is only an estimate of what's happening on the ground.